Mortgage lender maps show how segregation caused inequalities for minority families
While New Jersey is one of the most diverse states in the nation, it also has a history of being one of the most segregated.
•
Jun 20, 2020, 12:37 AM
•
Updated 1,951 days ago
Share:
More Stories
2:23
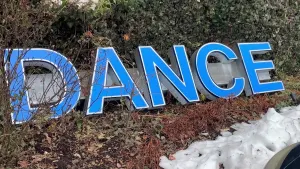
Positively New Jersey: Family-owned studio is staple in NJ dance community
650ds ago2:09
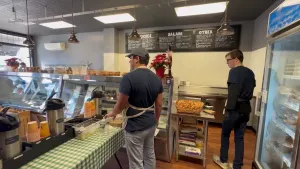
Positively New Jersey: Manasquan café serves up kindness 3 days per week
679ds ago2:15

Limpkin bird spotted in Wall Township; a rare sighting in New Jersey
708ds ago2:27

NJ animal shelter allows people to take dogs out on ‘field trips’
713ds ago3:04

New Jersey veterans paired with service dogs to cope with PTSD
714ds ago1:48

Winter Lantern Festival to be held indoors for the first time at American Dream
719ds ago2:23
Positively New Jersey: Family-owned studio is staple in NJ dance community
650ds ago2:09
Positively New Jersey: Manasquan café serves up kindness 3 days per week
679ds ago2:15
Limpkin bird spotted in Wall Township; a rare sighting in New Jersey
708ds ago2:27
NJ animal shelter allows people to take dogs out on ‘field trips’
713ds ago3:04
New Jersey veterans paired with service dogs to cope with PTSD
714ds ago1:48
Winter Lantern Festival to be held indoors for the first time at American Dream
719ds agoWhile New Jersey is one of the most diverse states in the nation, it also has a history of being one of the most segregated.
There is currently a lot of discussion about systemic racism in the country. One of the things that hold society back from making progress on the issue is that it is a hard concept for some people to grasp. But News 12 New Jersey’s Brian Donohue recently discovered some documents that may help illustrate how systemic racism impacted minority communities for decades.
Donohue recently found maps of his hometown of Union Township that were made by the federal government’s Home Owner’s Loan Corporation in 1935. The corporation sent appraisers to cities and towns across the country to grade neighborhoods on a four-part scale to advise banks on whether to loan money for mortgages in those areas.
Areas of the towns were highlighted in colors – green meant a loan was advisable, red meant loans were not. For the Union Township map, the red sections were then predominately Black neighborhoods. The documents made no secret as to why the areas were highlighted in red.
The Vauxhall section of town was declared hazardous for lenders because “Negroes and poor classes of Italians are scattered through the area.” Other maps of New Jersey towns show similar conditions, often with language that is considered racist and prejudiced today.
Neighborhoods with even just two or three Black families were considered risky for home mortgage lenders. A section of Bayonne was given a yellow grading for lenders because “Negroes are concentrated in the small section of town shown in red on the map and there seems to be little danger of them spreading.”
“It’s unbelievable what you’ll find in these documents,” says Robert Nelson, of the University of Richmond.
Nelson is the director of digital scholarship at the university, which has digitized and reassembled the maps for the Mapping Inequality Project.
Nelson says that the maps often created self-fulfilling prophecies, saying, “it causes disinvestment in these areas.”
Researchers found that the maps caused increased segregation and disinvestment in minority neighborhoods. The maps show some of the policies that for decades shut millions of Black families from owning homes.
“As home values shoot up and that becomes a repository for a lot of the ways families build and store their wealth and convey it to their children, that doesn’t happen for families of color,” Nelson says. “It’s one of the reasons the average wealth of white families is many times that of Black families in 2020.”
The maps are available for viewing on the University of Richmond’s website.
More from News 12
1:49
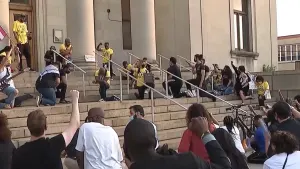
Rally held in Paterson to mark 1 year anniversary of George Floyd’s death
0:14

Prosecutor: Man admits to trying to set police car on fire during Trenton riot
0:39
Maplewood Middle School holds discussions on racism following Derek Chauvin verdict
1:56
Paterson works to strengthen trust between police and community in post-Chauvin guilty verdict
2:15
Paterson officials work to regain trust between community and police
3:33